- SolutionsLearn about data-first solutions for empowering collective creativity across the organization.
Technology solutions
Experience Design
Create impactful customer experiences.
Software Product Assessment
Keep technical debt in check before launch.
Application Modernization
Scale with future-proof applications.
Application Development & Management
Deploy custom, secure applications—fast.
Systems Integration
Break down silos to truly innovate.
Cloud & Infrastructure
Get on the right track to cloud migration.
Artificial Intelligence & Machine Learning
Experience cutting-edge transformation.
IoT
Tap into new data and revenue streams.
Video Engineering
Engage audiences with video solutions.
Cybersecurity
Scale confidently with secure systems.
Data solutions
Data Strategy & Architecture
Set the foundation for data-first innovations.
Data Analytics & Visualization
Turn raw data into powerful insights.
Data Management & Engineering
Get quality insights with quality data.
Data Science & AI
Accelerate access to valuable, actionable insights.
Data Virtualization
Quickly adapt with real-time, unified data.
- PlatformDiscover the proprietary platforms we built to help organizations accelerate outcomes.
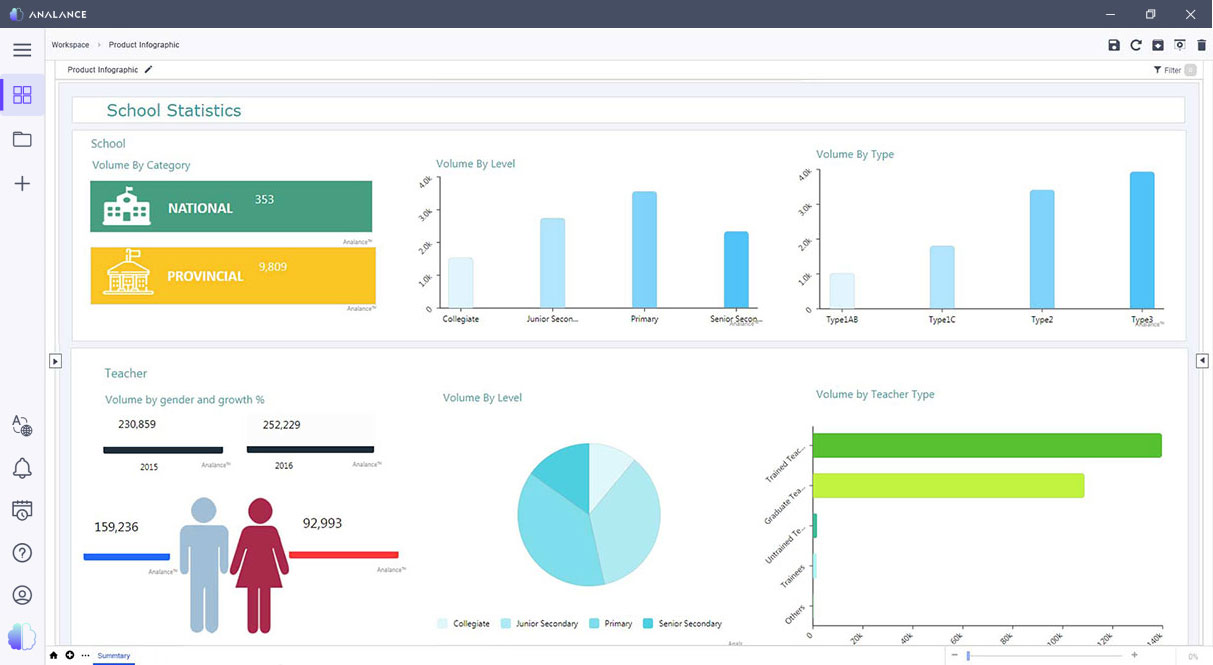
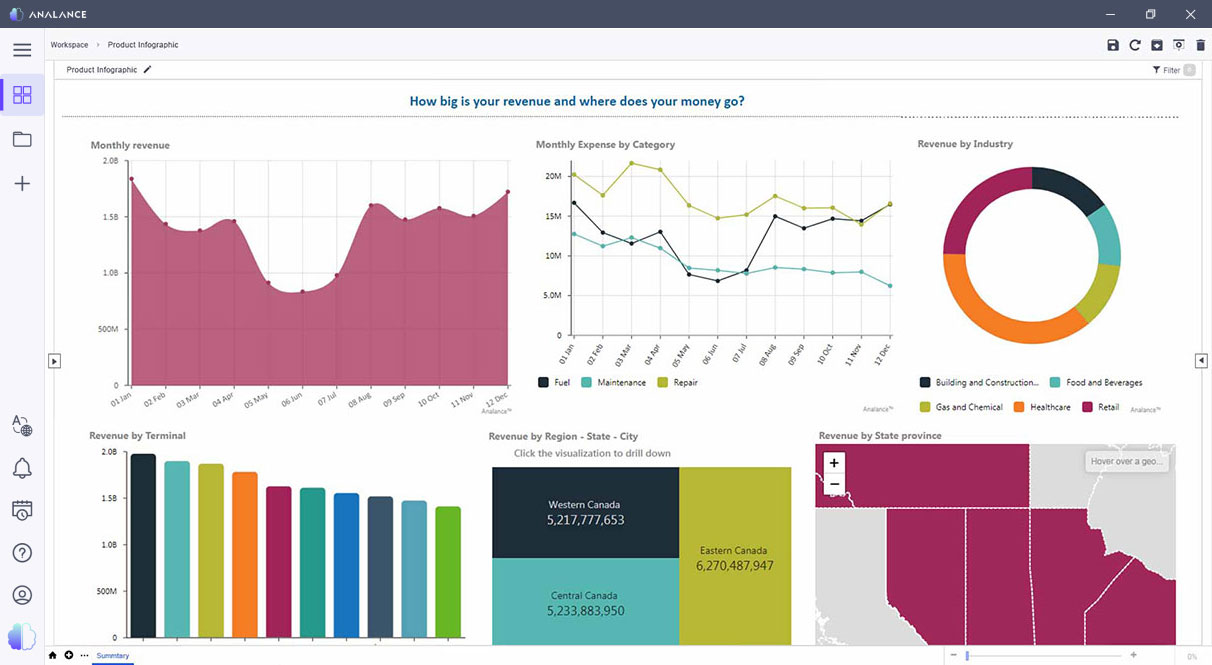
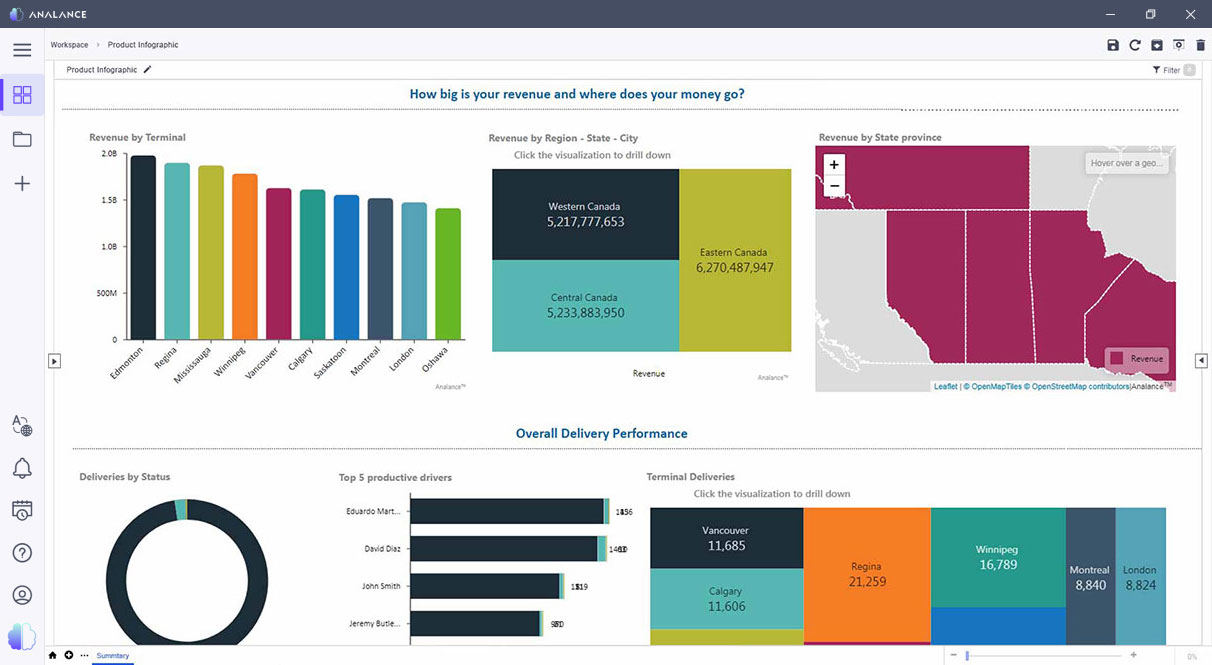
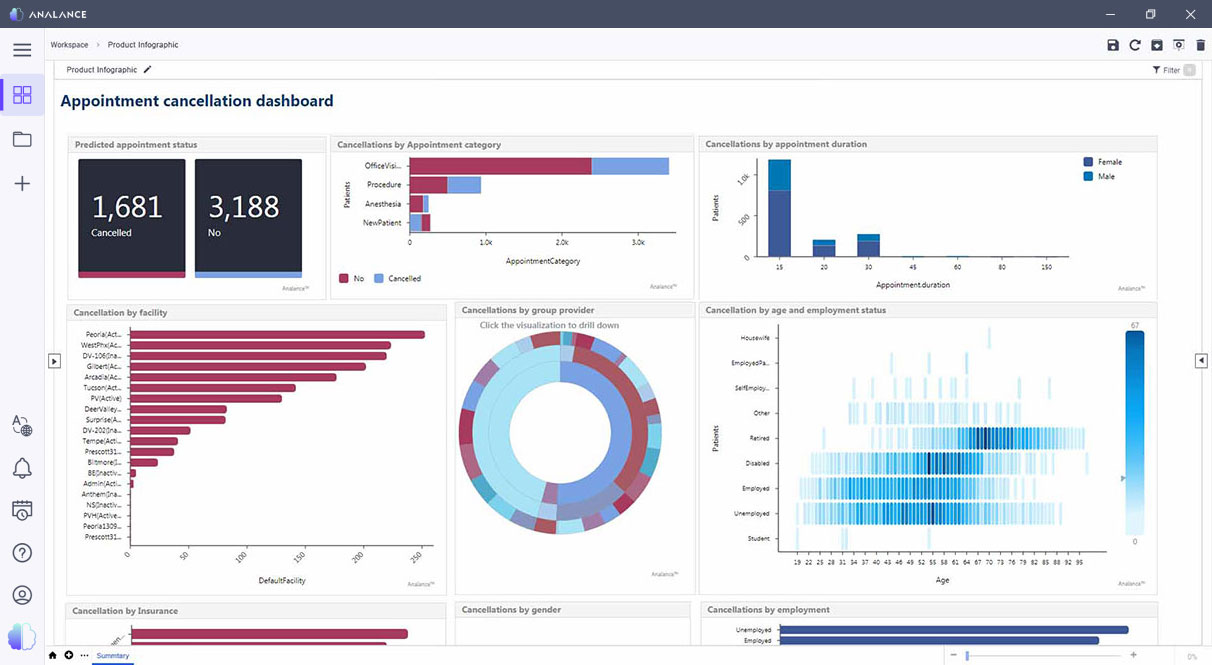
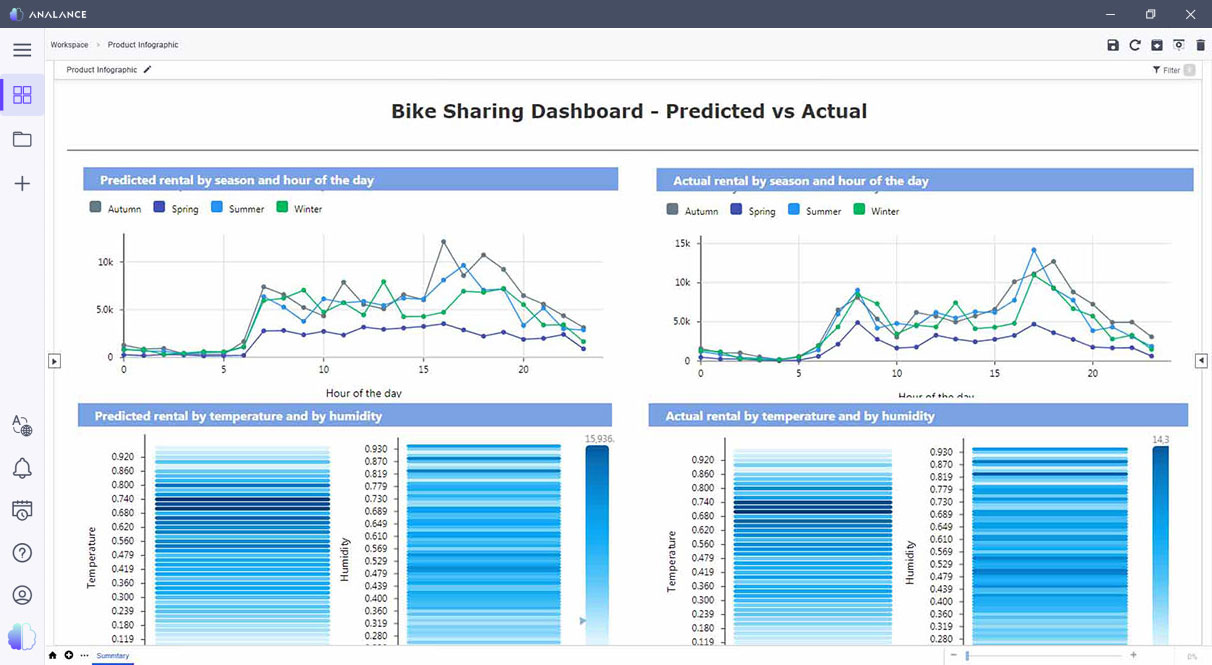
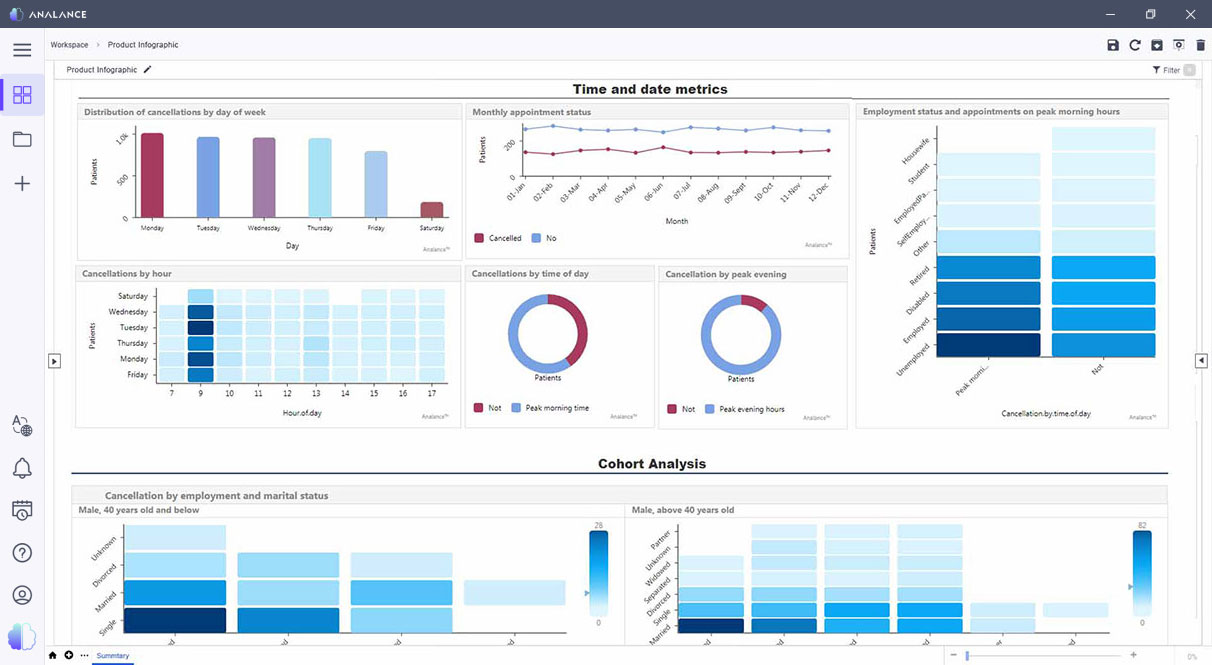
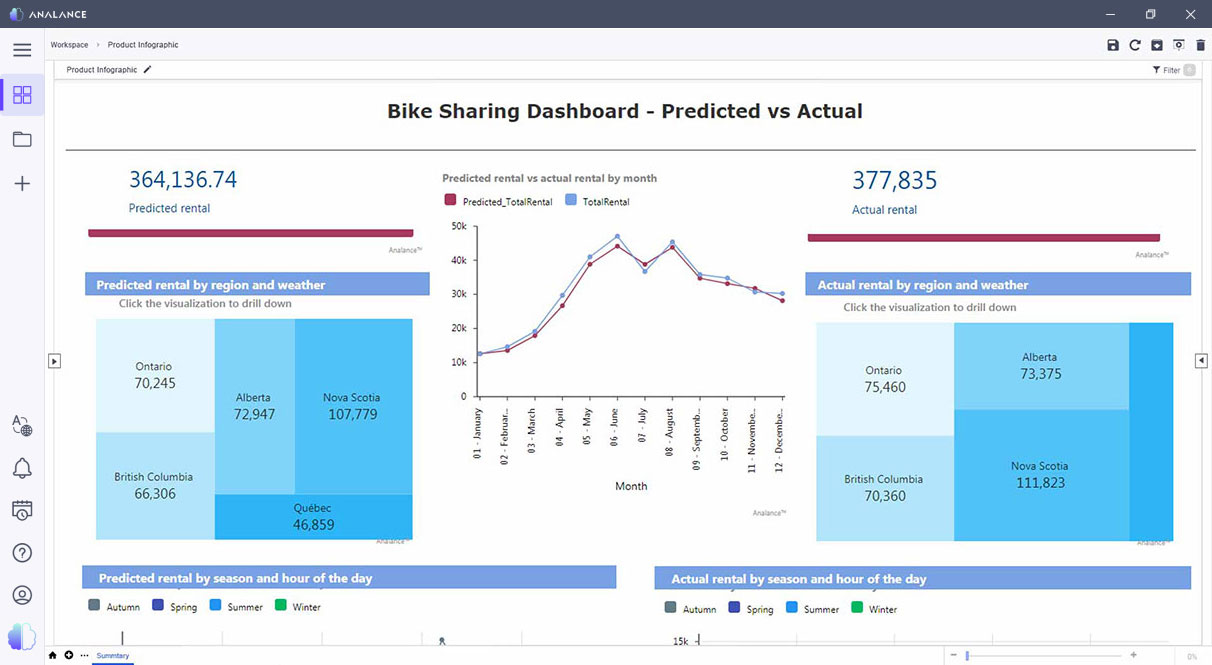
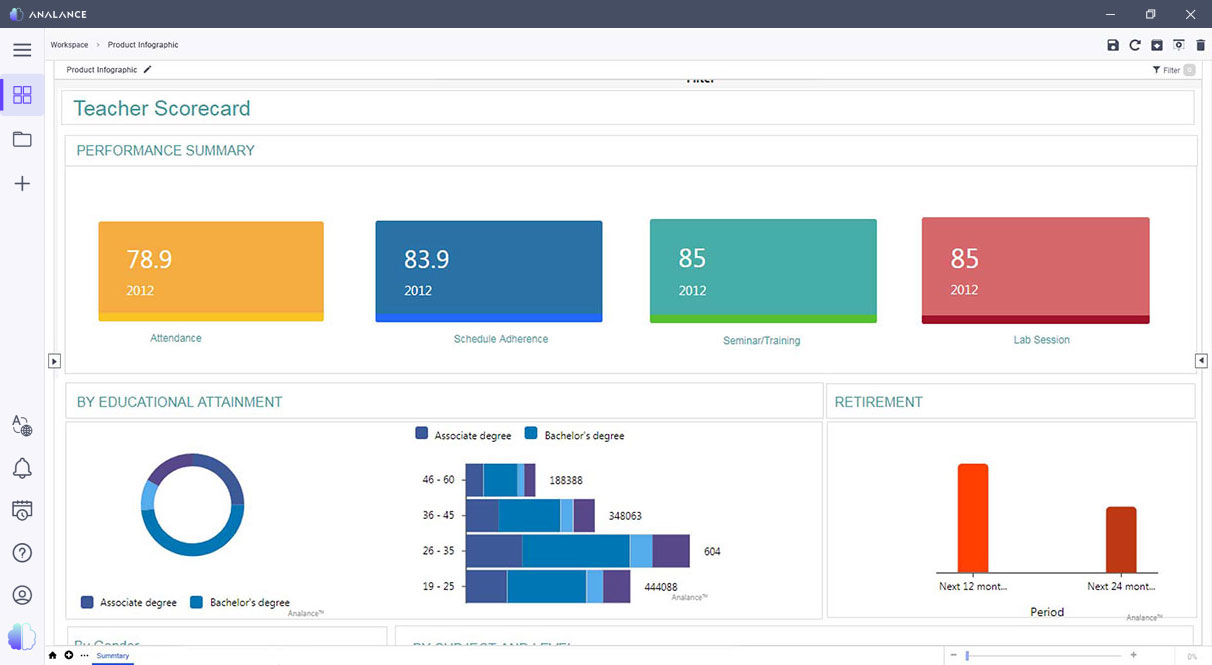
Analance Business Intelligence
Bring your data to life with interactive charts, graphs, and dashboards.
Orion Matrix
Video Services API Revolution.
Orion Stack
Device Software Platform.
IP/Telephony Network Management System (Previsor)
Streamlined Network Management Solution.
- Learn
About
Learn about how we empower you to forge forward fearlessly.
Careers
Innovation and people are at the heart of what we do. Join us!
Our locations
We are global. Discover a Sryas location near you.
Customer stories
Fearless goals, determined innovators. Read their success stories.
Blog
Access exclusive data & tech insights.